
Figuring out where our families will live and grow is arguably one of the most exciting parts of “adulting.” (Let’s be real: who doesn’t enjoy scrolling through Zillow to dream about what could be? Or filling Pinterest boards with interior decor ideas that you could totally DIY?)
And yet, while finding a new home can be fun, the process can become daunting once you start factoring in the not-so-fun part of adulting: your family’s living costs.
Typically, these “costs of living” include the usual real estate expenses that you need to consider — namely, mortgage and property taxes. But if you’re a parent, you also need to start thinking about child care costs, too.
Will you have babysitters or a nanny to help you out? Or will you need to look into what child care centers are in the area? All of these are good questions to ask yourself that, inevitably, will lead you to ask an even bigger one: Would we be better off living in an urban area, or in a suburb?
To answer this question, analysts from Care.com and Zillow combined efforts to publish the 2017 Cost of Living report. In it, we looked at the data around the cost of living in cities versus ‘burbs to find out where families can get the most bang for their buck.
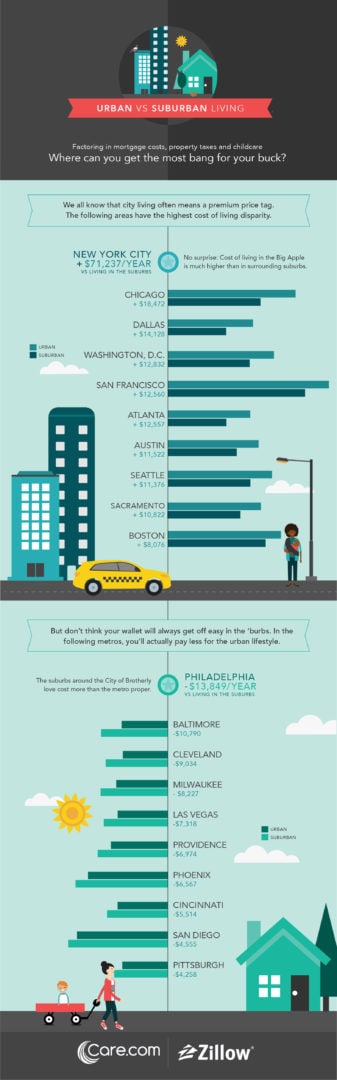
Take a look at the infographic below to see the 10 areas where it pays to live in the suburbs, and the 10 areas where you’re better off living in the city itself. (If you’d like to see the full data set, just scroll all the way down the page.)
Let’s Hear It for the ‘Burbs
According to this first-of-its-kind study, Care.com and Zillow found that city-dwelling families nationwide spend around $9,073 more per year to cover basic housing and child care costs than ‘burb-dwelling families. In some metros like New York or Chicago, families can expect to pay as much as $71,237 more per year for these expenses in the city than they would in the suburbs. That equates to nearly $6,000 extra per month.
On average, child care centers are less expensive in suburban areas than in urban areas. Families living in the ‘burbs of Washington, D.C. and San Francisco see the biggest savings in child care costs — families with two kids could save $6,123 or $5,917, respectively, on a child care center, compared to their counterparts in the city. In Minneapolis, the annual cost of housing in an urban neighborhood ($14,710) is almost the same as that in a suburban area ($14,899). However, suburban families with two kids can save $4,119 on a child care center — or $1,759 on a nanny — which ends up making the total cost of suburban living lower.
It’s also worth noting that suburban homes are typically larger than urban homes, which could be a deciding factor for many families that are looking to expand. So the study looked at home size, too. For example, families in Austin see the biggest bang for their buck when moving to the suburbs, since homes there tend to be 572 square feet larger than those found in the city.
They Don’t Call Them “Urban Oases” for Nothin’
Keep in mind that although there it can be cost-effective to live in the suburbs, that doesn’t mean it’s always the cheaper option.
Specifically, it turns out that families in Philadelphia and Las Vegas could end up saving about $14,000 a year if they lived in the city, rather than in their respective suburbs.
Care.com and Zillow found that for the cities of Providence, Las Vegas and Philadelphia, child care centers are actually more expensive in the suburbs than they are in the urban core. On average, a child care center in urban Providence costs $17,504 a year for two kids, while a child care center in the suburbs costs $20,473 a year. In this scenario, parents in Providence could actually save almost $3,000 on child care by living in the city!
So, although there are some draws to living in the suburb, it’s clear that families need to do their research before they put all their eggs in the suburbia basket.
For the full data set, take a look at the table below. You can sort the cities according to specific living costs.
| Metro | Area Type | Suburban vs. Urban Living Cost Difference | Annual Child Care Costs (Child Care Center for 2 Kids) | Total Annual Housing and Child Care Expenses | Annual Property Taxes and Mortgage Payment | Median Sq. Ft. |
| United States | Suburban | ($9,073) | $19,573 | $34,579 | $15,006 | 1,654 |
| United States | Urban | $21,381 | $43,652 | $22,271 | 1,375 | |
| Atlanta, GA | Suburban | ($12,557) | $17,236 | $30,805 | $13,569 | 1,988 |
| Atlanta, GA | Urban | $20,927 | $43,362 | $22,435 | 1,611 | |
| Austin, TX | Suburban | ($11,522) | $18,989 | $36,268 | $17,279 | 1,988 |
| Austin, TX | Urban | $22,129 | $47,790 | $25,661 | 1,416 | |
| Baltimore, MD | Suburban | $10,790 | $19,493 | $35,061 | $15,568 | 1,525 |
| Baltimore, MD | Urban | $18,367 | $24,271 | $5,904 | 1,292 | |
| Birmingham, AL | Suburban | ($696) | $20,820 | $34,158 | $13,338 | 1,523 |
| Birmingham, AL | Urban | $18,356 | $34,854 | $16,498 | 1,360 | |
| Boston, MA | Suburban | ($8,076) | $27,078 | $51,561 | $24,483 | 1,666 |
| Boston, MA | Urban | $27,507 | $59,637 | $32,130 | 1,262 | |
| Chicago, IL | Suburban | ($18,472) | $20,386 | $48,794 | $28,408 | 1,532 |
| Chicago, IL | Urban | $21,931 | $67,266 | $45,335 | 1,241 | |
| Cincinnati, OH | Suburban | $5,514 | $16,613 | $31,880 | $15,267 | 1,604 |
| Cincinnati, OH | Urban | $13,759 | $26,366 | $12,607 | 1,420 | |
| Cleveland, OH | Suburban | $9,034 | $17,513 | $32,647 | $15,134 | 1,572 |
| Cleveland, OH | Urban | $15,988 | $23,613 | $7,625 | 1,356 | |
| Dallas-Fort Worth, TX | Suburban | ($14,128) | $16,373 | $30,715 | $14,342 | 1,893 |
| Dallas-Fort Worth, TX | Urban | $20,426 | $44,843 | $24,417 | 1,639 | |
| Denver, CO | Suburban | $3,635 | $21,184 | $66,059 | $44,875 | 1,642 |
| Denver, CO | Urban | $21,860 | $62,424 | $40,564 | 1,215 | |
| Houston, TX | Suburban | ($5,368) | $15,268 | $27,852 | $12,584 | 1,964 |
| Houston, TX | Urban | $16,682 | $33,220 | $16,538 | 1,700 | |
| Las Vegas, NV | Suburban | $7,318 | $17,711 | $33,645 | $15,934 | 1,800 |
| Las Vegas, NV | Urban | $15,846 | $26,327 | $10,481 | 1,478 | |
| Los Angeles-Long Beach-Anaheim, CA | Suburban | $407 | $21,280 | $56,223 | $34,943 | 1,608 |
| Los Angeles-Long Beach-Anaheim, CA | Urban | $21,774 | $55,816 | $34,042 | 1,386 | |
| Miami-Fort Lauderdale, FL | Suburban | ($1,943) | $16,860 | $33,158 | $16,298 | 1,483 |
| Miami-Fort Lauderdale, FL | Urban | $18,664 | $35,101 | $16,437 | 1,222 | |
| Milwaukee, WI | Suburban | $8,227 | $21,246 | $35,346 | $14,100 | 1,419 |
| Milwaukee, WI | Urban | $19,688 | $27,119 | $7,431 | 1,271 | |
| Minneapolis-St Paul, MN | Suburban | ($3,930) | $19,970 | $34,869 | $14,899 | 1,351 |
| Minneapolis-St Paul, MN | Urban | $24,089 | $38,799 | $14,710 | 1,250 | |
| New Orleans, LA | Suburban | $836 | $14,165 | $39,345 | $25,180 | 1,792 |
| New Orleans, LA | Urban | $14,834 | $38,509 | $23,675 | 1,661 | |
| New York, NY | Suburban | ($71,237) | $23,253 | $51,921 | $28,668 | 1,704 |
| New York, NY | Urban | $21,568 | $123,158 | $101,590 | 1,428 | |
| Philadelphia, PA | Suburban | $13,859 | $19,575 | $39,014 | $19,439 | 1,760 |
| Philadelphia, PA | Urban | $17,753 | $25,155 | $7,402 | 1,254 | |
| Phoenix, AZ | Suburban | $6,567 | $17,110 | $49,207 | $32,097 | 1,792 |
| Phoenix, AZ | Urban | $15,747 | $42,640 | $26,893 | 1,560 | |
| Pittsburgh, PA | Suburban | $4,258 | $17,185 | $28,173 | $10,988 | 1,452 |
| Pittsburgh, PA | Urban | $16,999 | $23,915 | $6,916 | 1,420 | |
| Portland, OR | Suburban | ($7,998) | $19,938 | $41,847 | $21,909 | 1,625 |
| Portland, OR | Urban | $23,270 | $49,845 | $26,575 | 1,452 | |
| Providence, RI | Suburban | $6,974 | $20,473 | $36,867 | $16,394 | 1,483 |
| Providence, RI | Urban | $17,504 | $29,893 | $12,389 | 1,296 | |
| Sacramento, CA | Suburban | ($10,822) | $18,873 | $38,428 | $19,555 | 1,683 |
| Sacramento, CA | Urban | $23,403 | $49,250 | $25,847 | 1,428 | |
| San Antonio, TX | Suburban | $2,474 | $16,135 | $27,513 | $11,378 | 1,770 |
| San Antonio, TX | Urban | $16,913 | $25,039 | $8,126 | 1,418 | |
| San Diego, CA | Suburban | $4,555 | $21,398 | $52,394 | $30,996 | 1,633 |
| San Diego, CA | Urban | $20,036 | $47,839 | $27,803 | 1,336 | |
| San Francisco, CA | Suburban | ($12,560) | $26,177 | $72,264 | $46,087 | 1,596 |
| San Francisco, CA | Urban | $32,094 | $84,824 | $52,730 | 1,315 | |
| San Jose, CA | Suburban | $1,628 | $27,991 | $87,530 | $59,539 | 1,565 |
| San Jose, CA | Urban | $30,514 | $85,902 | $55,388 | 1,525 | |
| Seattle, WA | Suburban | ($11,376) | $22,003 | $43,292 | $21,289 | 1,816 |
| Seattle, WA | Urban | $26,319 | $54,668 | $28,349 | 1,592 | |
| Washington, DC | Suburban | ($12,832) | $21,660 | $43,085 | $21,425 | 1,724 |
| Washington, DC | Urban | $27,783 | $55,917 | $28,134 | 1,292 |
Methodology — Care.com
Care.com used its child care center profiles in 2016 for two children in the same center to determine annual child care costs. Weekly rates were multiplied by 52 weeks, and monthly rates were multiplied by 12 months to find annual rates. To find the cost of a nanny, Care.com used data from full-time child care jobs posted on its site in 2016 for two children. A nanny’s hourly rate was multiplied by 40 hours and 52 weeks to find the annual rate.
Methodology — Zillow
Zillow surveyed Americans to determine if their communities are primarily urban or suburban then used that data to create a statistical model that predicts the urban or suburban status of a zip code. Using those classifications, real estate experts at Zillow determined the median home value of homes in urban and suburban metro areas. Zillow compared property taxes paid and tax assessments from public records and took the ratio when they determined property tax data. Then they applied those rates to the median home value.
If you would like to read Zillow’s Cost of Living report, you can check it out here.
Want to check out more of our studies? Feel free to peruse this list:
- The 20 Most Family-Friendly Cities for Halloween in 2016
- The 10 Best Cities in America to Raise the Next Rock Star
- The Best — and Worst — States for Child Care
- Best in Style: These 10 Cities Have the Best-Groomed Dogs
- Dads Are Getting More Involved on Valentine’s Day — Here’s How
- Grab Your Pup’s Leash: These Are the Best U.S. Cities for Walking Your Dog
- How Child Care Could Swing the Election
- How Much Do the Holidays Cost?
- Listen up, College Kids: Here Are the Top 20 Cities to Make Bank Over Break
- Think You’re a Neat Freak? Here’s Where People Pay the Most for Housekeeping
- Want a New You in the New Year? Here’s Where You’re Most Likely to Make That Happen in 2017
- Want to Babysit on Valentine’s Day? These Are the Cities Where You Could Make Bank


