
This has truly been an election season unlike any we’ve seen before. In so many ways, the Democratic and Republican nominees have been game-changing candidates. And we’re going to dive into one of their “firsts” here.
For perhaps the first time in history, both major party candidates have introduced plans for a national paid leave policy and to make child care more affordable. Above all of the noise — all of the bickering, posturing and punditry — the election could come down to a single question for many Americans: How is this candidate going to help my family?
It’s a question that’s been on our minds as well. As Election Day 2016 approaches, we took a look at the candidates’ respective plans to gauge what kind of impact they might have on the millions of American families struggling to afford quality care for their loved ones.
To get an idea about how a typical family’s situation would change based on the candidates’ plans, we aggregated existing data from sources including the Census Bureau, AARP, Bureau of Labor Statistics and Care.com’s Care Index and applied it to what the two campaigns have published on their websites regarding their respective paid leave and child care proposals. For our calculations, we used households with two parents at three different income levels — the federal poverty level, median household income, and Top 1 percent in the United States — and in five “swing” states: Colorado, Florida, Iowa, Ohio and Pennsylvania.
We know there’s no such thing as a “typical” American family, just as we know there are many unanswered questions in both plans, that the plans are subject to change and that they will need to be funded at a cost expected to be in the hundreds of billions spread over the next decade. But using the information available today, we wanted to show the benefits families could receive from these plans. And that’s what you’ll find in the graphics, charts and text below.
Cost of Child Care
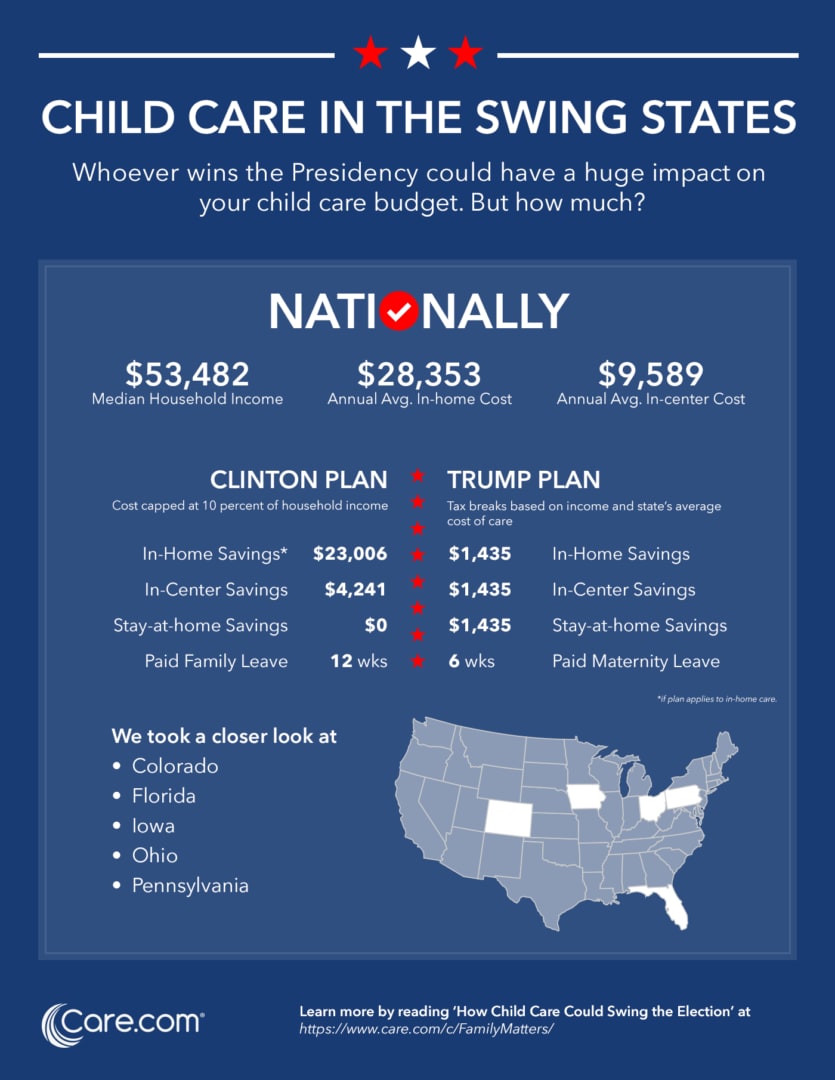
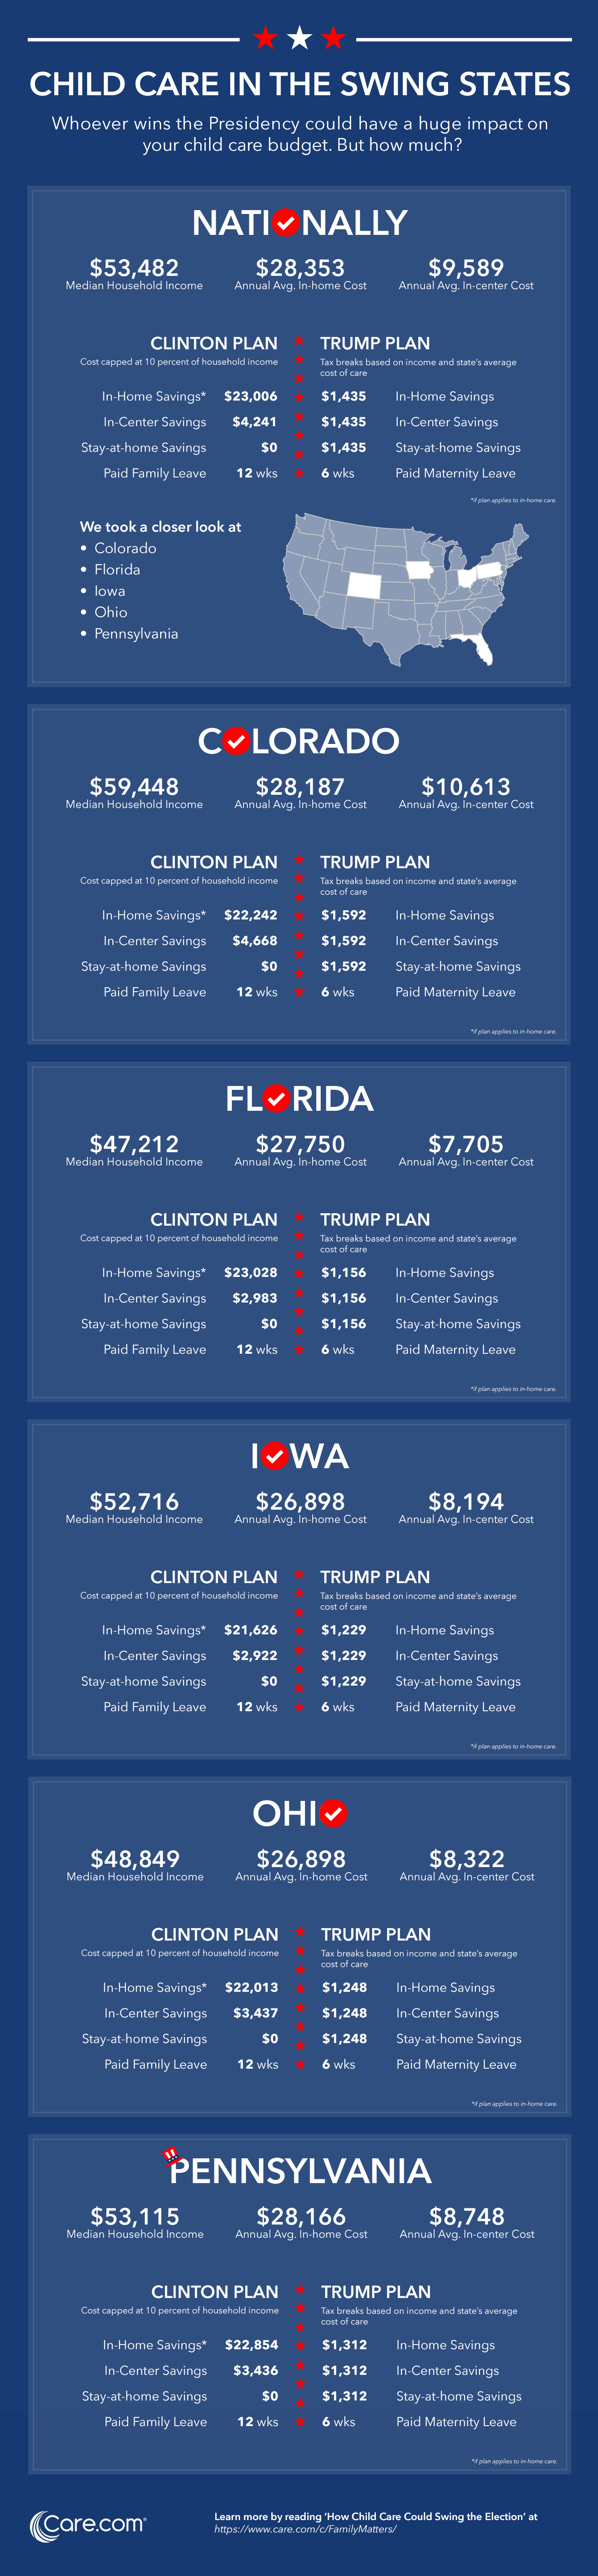
For many families today, child care is the largest household budget item. The average cost of full-time care in child care centers in the United States is $9,589 a year – 18 percent of median household income, and two-thirds of income for an individual earning minimum wage. In-home care is even more expensive – the typical cost for a full-time in-home caregiver or nanny is $28,353 a year.
When care becomes unaffordable, parents face impossible choices. Studies show that when children lack access to quality care during the critically important ages of 0-4 years old, brain development can suffer. Parents who withdraw from the workforce because care is cost-prohibitive limit their lifetime earning potential. Employers lose their contributions and incur turnover costs. The economy loses billions in economic activity.
The pain is real, so it’s not surprising both Clinton and Trump have announced plans to address America’s mounting care crisis.
We crunched the numbers to see how each of the plans would affect the cost of care for households with two parents at three income levels – median, poverty level and Top 1 percent. We did the math at a nationwide level, as well as state-specific calculations for families in the swing states of Colorado, Florida, Iowa, Ohio and Pennsylvania.
This chart shows the how the candidates’ plans would impact American families. Our methodology is explained below.
|
Natl. Avg: |
Current Child Care Cost |
Clinton’s Plan: Child Care Cost |
Trump’s Plan: Child Care Cost |
|||
|
Income |
In-Home |
In-Center |
In-Home |
In-Center |
In-Home |
In-Center |
|
Poverty: $24,036 |
n/a (unaffordable) |
$9,589 |
n/a (unaffordable) |
$2,404 (savings: $7,185) |
n/a (unaffordable) |
$8,154 (savings: $1,435) |
|
Median: $53,482 |
$28,354 |
$9,589 |
$5,348 (savings: $23,006) |
$5,348 (savings: $4,241) |
$26,919 (savings: $1,435) |
$8,154 (savings: $1,435) |
|
1 Percent: $389,436 |
$28,354 |
$9,589 |
$28,354 (savings: $0) |
$9,589 (savings: $0) |
$26,685 (savings: $3,164) |
$6,425 (savings: $3,164) |
According to details published on her website, Clinton’s plan would limit spending on child care to 10 percent of household income by increasing government investment in child care subsidies and tax relief. To illustrate how this plan would affect American families, we compared child care costs capped at 10 percent of three levels of household income to Care.com’s Care Index data on the average cost of care at the national level and the five swing states. Note: It’s unclear how Clinton’s plan would apply to families who employ in-home caregivers.
According to the Fact Sheet published on his website, Trump’s plan would allow parents to exclude up to the state’s average cost of child care from income tax from birth through age 13. This exclusion would cover up to four children per family, and would cover a variety of types of care – institutional, private, nursery school, after-school and enrichment activities. And it would be available to all parents, regardless of whether they use paid caregivers or informal family care arrangements.
We applied tax rates for married joint filers with one child at the national poverty level, median income and Top 1 Percent families to Care.com’s Care Index average in-home child care costs to determine an estimated exclusion amount. (At the national and state levels, we applied a 15 percent tax rate to poverty and median income levels, and 33 percent to Top 1 Percent earners.) We then subtracted that number from the average cost of in-center and in-home care to show estimated annual savings to families.
Focus on the Swing States
In Colorado, in-home care costs an average of $28,187 per year and in-center care costs an average of $10,613 annually. The average cost of care in Colorado is 28 percent of the median household income. The chart below shows how each of the candidates’ plans would impact Colorado families at three income levels.
|
Colorado Avg.: |
Current Child Care Cost |
Clinton’s Plan: Child Care Cost |
Trump’s Plan: Child Care Cost |
|||
|
Income |
In-Home |
In-Center |
In-Home |
In-Center |
In-Home |
In-Center |
|
Poverty: $24,036 |
n/a (unaffordable) |
$10,613 |
n/a (unaffordable) |
$2,404 (savings: $8,209) |
n/a (unaffordable) |
$9,021 (savings: $1,592) |
|
Median: $59,448 |
$28,187 |
$10,613 |
$5,945 (savings: $22,242) |
$5,945 (savings: $4,668) |
$26,595 (savings: $1,592) |
$9,021 (savings: $1,592) |
|
1 Percent: $410,176 |
$28,187 |
$10,613 |
$28,187 (savings: $0) |
$10,613 (savings: $0) |
$26,685 (savings: $3,502) |
$7,110 (savings: $3,502) |
In Florida, in-home care costs an average of $27,750 per year and in-center care costs an average of $7,705 annually. The average cost of care in Florida is 29 percent of the median household income. The chart below shows how each of the candidates’ plans would impact Florida families at three income levels.
|
FL Avg.: |
Current Child Care Cost |
Clinton’s Plan: Child Care Cost |
Trump’s Plan: Child Care Cost |
|||
|
Income |
In-Home |
In-Center |
In-Home |
In-Center |
In-Home |
In-Center |
|
Poverty: $24,036 |
n/a (unaffordable) |
$7,705 |
n/a (unaffordable) |
$2,404 (savings: $5,301) |
n/a (unaffordable) |
$6,549 (savings: $1,156) |
|
Median: $47,212 |
$27,750 |
$7,705 |
$4,721 (savings: $23,028) |
$4,721 (savings: $2,983) |
$26,594 (savings: $1,156) |
$6,549 (savings: $1,156) |
|
1 Percent: $385,000 |
$27,750 |
$7,705 |
$27,750 (savings: $0) |
$7,705 (savings: $0) |
$25,207 (savings: $2,543) |
$5,162 (savings: $2,543) |
In Iowa, in-home care costs an average of $26,898 per year and in-center care costs an average of $8,194 annually. The average cost of care in Iowa is 23 percent of the median household income. The chart below shows how each of the candidates’ plans would impact Iowa families at three income levels.
|
Iowa Avg: |
Current Child Care Cost |
Clinton’s Plan: Child Care Cost |
Trump’s Plan: Child Care Cost |
|||
|
Income |
In-Home |
In-Center |
In-Home |
In-Center |
In-Home |
In-Center |
|
Poverty: $24,036 |
n/a (unaffordable) |
$8,194 |
n/a (unaffordable) |
$2,404 (savings: $5,790) |
n/a (unaffordable) |
$6,964 (savings: $1,229) |
|
Median: $52,716 |
$26,898 |
$8,194 |
$5,272 (savings: $21,626) |
$5,272 (savings: $2,922) |
$25,669 (savings: $1,229) |
$6,964 (savings: $1,229) |
|
1 Percent: $317,234 |
$26,898 |
$8,194 |
$26,898 (savings: $0) |
$8,194 (savings: $0) |
$24,195 (savings: $2,704) |
$5,490 (savings: $2,704) |
In Ohio, in-home care costs an average of $26,898 per year and in-center care costs an average of $8,322 annually. The average cost of care in Ohio is 31 percent of the median household income. The chart below shows how each of the candidates’ plans would impact Ohio families at three income levels.
|
Ohio. Avg.: |
Current Child Care Cost |
Clinton’s Plan: Child Care Cost |
Trump’s Plan: Child Care Cost |
|||
|
Income |
In-Home |
In-Center |
In-Home |
In-Center |
In-Home |
In-Center |
|
Poverty: $24,036 |
n/a (unaffordable) |
$8,322 |
n/a (unaffordable) |
$2,404 (savings: $5,918) |
n/a (unaffordable) |
$7,074 (savings: $1,248) |
|
Median: $48,849 |
$26,898 |
$8,322 |
$4,885 (savings: $22,013) |
$4,885 (savings: $3,437) |
$25,650 (savings: $1,248) |
$7,074 (savings: $1,248) |
|
1 Percent: $316,000 |
$26,898 |
$8,322 |
$26,898 (savings: $0) |
$8,322 (savings: $0) |
$24,151 (savings: $2,746) |
$5,576 (savings: $2,746) |
In Pennsylvania, in-home care costs an average of $28,166 per year and in-center care costs an average of $8,748 annually. The average cost of care in Pennsylvania is 28 percent of the median household income. The chart below shows how each of the candidates’ plans would impact Pennsylvania families at three income levels.
|
Pennsylvania Avg.: |
Current Child Care Cost |
Clinton’s Plan: Child Care Cost |
Trump’s Plan: Child Care Cost |
|||
|
Income |
In-Home |
In-Center |
In-Home |
In-Center |
In-Home |
In-Center |
|
Poverty: $24,036 |
n/a (unaffordable) |
$9,589 |
n/a (unaffordable) |
$2,404 (savings: $7,185) |
n/a (unaffordable) |
$8,154 (savings: $1,435) |
|
Median: $53,482 |
$28,354 |
$9,589 |
$5,348 (savings: $23,006) |
$5,348 (savings: $4,241) |
$26,919 (savings: $1,435) |
$8,154 (savings: $1,435) |
|
1 Percent: $389,436 |
$28,354 |
$9,589 |
$28,354 (savings: $0) |
$9,589 (savings: $0) |
$26,685 (savings: $3,164) |
$6,425 (savings: $3,164) |
Both candidates have additional elements of their plans, beyond the savings we’ve outlined above.
For lower income families, who have no income tax liability, Trump’s plan includes an Earned Income Tax Credit of half the payroll taxes they pay. The EITC would be subject to an income limitation of $31,200. This EITC – of almost $1,200 per year per eligible family — could be deposited directly into the family’s child care savings account.
Further, Trump’s proposal says families would be able to deposit up to $2,000 per year (tax-free) for each child in a Dependent Care Savings Account, which they could use for child care, education or enrichment. The unused balance in the account would be rolled over year to year, and could be put toward to college if there’s anything left after the child turns 18. To incentivize contributions to this program from low-income families, Trump’s proposal includes a government match of up to $500 on the first $1,000. Currently, about 40 percent of civilian workers have access to employer-sponsored dependent care reimbursement accounts, according to the Bureau of Labor Statistics.
Trump’s plan also calls for incentives for employers to provide child care at the workplace. Although about 65 percent of children under 6-years-old live in households where all parents work, the most recent National Study of Employers found only about 7 percent of employers provide child care at or near the worksite.
In addition to capping child care costs, Clinton’s plans include improving early childhood education by offering universal pre-school for 4-year-olds, expanding the value of child care tax credits, and investing in America’s child care workforce.
Clinton’s proposal would also seek to make quality child care available to more college students by awarding scholarships of $1,500 per year for up to 1 million student parents and increasing access to on-campus center care, serving an additional 250,000 children. Currently, there are about 4.8 million college students raising children, according to the Institute for Women’s Policy Research.
Paid Leave
The United States is the only industrialized nation in the world without national paid maternity leave for new mothers after the birth of a child. Three states – California, New Jersey and Rhode Island – and a scattershot of cities have instituted their own paid family and medical leave policies. New York passed a law in 2016 that will take effect in 2018, Washington state has passed a law that never went into effect and several other states are considering proposals. In the meantime, only 14 percent of private sector employees currently have access to paid family leave through their employer.
The Family and Medical Leave Act (FMLA) provides 12 weeks of unpaid job protection for workers at companies with 50 or more employees. Through a combination of FMLA and short-term disability, many working moms are able to cobble together a makeshift maternity leave. But about 40 percent of the workforce is ineligible for FMLA, and many more can’t afford to risk losing a paycheck. Without a federal policy that applies to all workers, nearly 1 in 4 women return to work within two weeks of giving birth according to an analysis of Department of Labor Data commissioned by In These Times.
Both candidates have revealed proposals to institute a federal paid leave policy.
Trump’s plan would provide six weeks of maternity leave for women after the birth or adoption of a child, paid at the same amount the mother would collect in unemployment benefits had she been laid off. Clinton’s plan would provide up to 12 weeks of paid leave for a mom or dad after the birth or adoption of a child, and to anyone to care for sick family members; it would be paid at two-thirds of the employee’s regular salary.
To illustrate the impact of the candidates’ paid leave plans, we estimated the number of working moms who’d gain access to maternity leave by taking the Census 2015 American Community Survey Estimates for women who gave birth (3,931,053), applying the BLS estimate of mothers of infants who are in the workforce (58 percent) and subtracting 14 percent to account for private sector workers who currently have access to paid leave through their employers.
Under either plan, our estimates found about 2 million additional American mothers would be able to take paid maternity leave in a given year. To calculate how paid leave would change the situation of new moms in the swing states, we figured:
|
State |
Women Who Gave Birth |
Mothers of Infants in the Workforce |
Mothers with Employer-Provided Paid Leave |
Mothers Who’d Gain Access to Paid Leave |
|
Colorado |
65,555 |
38,022 |
5,323 |
32,699 |
|
Florida |
208,713 |
121,054 |
16,947 |
104,107 |
|
Iowa |
43,263 |
25,093 |
3,513 |
21,580 |
|
Ohio |
141,168 |
81,877 |
11,463 |
70,414 |
|
Pennsylvania |
149,372 |
86,636 |
12,129 |
74,507 |
To further reflect the scope of Clinton’s plan we took the estimated number of adults who care for adults or children in a given year (43.5 million), factored in AARP’s estimate that 60 percent of those caregivers are employed and subtracted 14 percent to account for public sector workers who already have access to paid family leave through an employer. This would result in an additional 22.4 million working caregivers who would have access to paid family leave under Clinton’s plan.
Conclusion
Details for the candidates’ plans remain relatively unclear. For example, how would Clinton’s plan cap child care costs at 10 percent of household income when our data shows care costs are 20 percent or more of median household income in all 50 states? How would Trump’s plan account for informal family care arrangements that it covers?
Additionally, whoever takes over the Oval Office, their plan will be subject to review and debate and budgeting. Whether or not these plans get implemented, or in what form, the fact remains that both Donald Trump and Hillary Clinton have game-changing proposals that recognize the realities of American families and would make it easier to care for their loved ones.
The work-life challenges our families face has undeniably become a part of the national conversation, and that’s progress.
Want to check out more of our studies? Feel free to peruse this list:
- The 20 Most Family-Friendly Cities for Halloween in 2016
- The 10 Best Cities in America to Raise the Next Rock Star
- The Best — and Worst — States for Child Care
- Dads Are Getting More Involved on Valentine’s Day — By the Numbers
- Grab Your Pup’s Leash: These Are the Best U.S. Cities for Walking Your Dog
- How Child Care Could Swing the Election
- How Much Do the Holidays Cost?
- Listen up, College Kids: Here Are the Top 20 Cities to Make Bank Over Break
- Want a New You in the New Year? Here’s Where You’re Most Likely to Make That Happen in 2017


