

Picture this: Your living room floor, free of children’s toys and assorted homework assignments.
A bedroom, any bedroom, minus those massive piles of laundry that loom menacingly in the corner.
Your bathroom, without that mysterious moldy smell…and even more mysterious grout stains.
Yes, these scenes are what (parents’) dreams are made of. And while most of us enjoy the feeling that comes with walking into a freshly cleaned house, it’s clear that some of us love that feeling a whole lot more more than others…and they’re willing to shell out mucho dinero to make house cleanings a very regular thing.
For its latest study, Care.com took a look at the data to find the cities where people spend the most money on hiring housekeeping help — whether it was a housekeeper, a maid, a house cleaner or a house cleaning service. In other words, we were looking for the cities with the biggest neat freaks.
Out of 57 cities, these 10 made the top of our list:
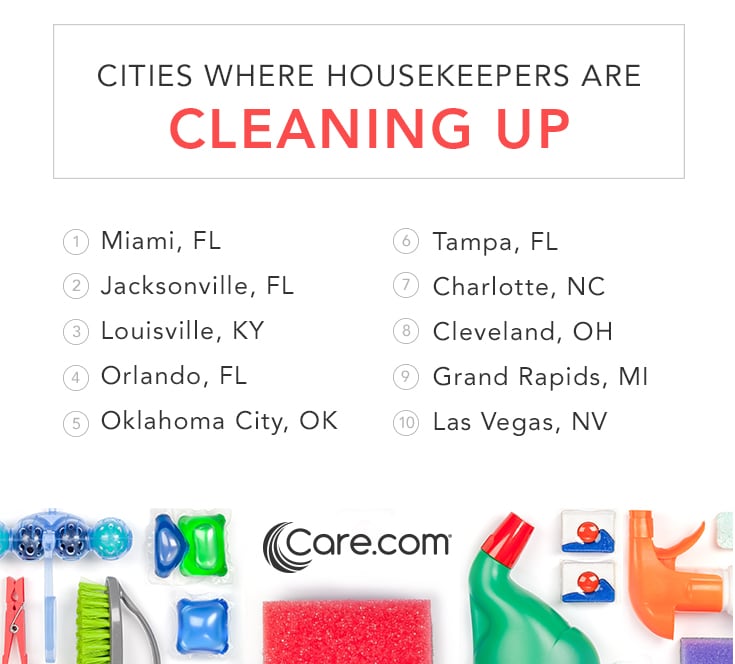
Having lived in Florida for more than 30 years, I’m not surprised to see so many cities from the Sunshine State on the list. Florida has a few extra things going for it that make cleaning an absolute necessity: sand, ocean water, hurricanes, constant humidity and a variety of weird bugs. NBD.
Needless to say, hiring housecleaning professionals helps Floridians feel like they aren’t living in one big swamp. Case in point: the citizens of Miami and Jacksonville spent 4.03 percent and 3.85 percent of their median income on housekeeping, respectively.
Want to see where your city landed in our ranking? Here’s the full list:
| City Name | Overall Ranking | Total $ Spent on Housekeeping Per Year | Median Income | Housekeeping Spend as a % of Median Income |
| Miami, FL | 1 | $1,964 | $48,745 | 4.03% |
| Jacksonville, FL | 2 | $2,001 | $51,998 | 3.85% |
| Louisville, KY | 3 | $1,914 | $51,205 | 3.74% |
| Orlando, FL | 4 | $1,824 | $48,768 | 3.74% |
| Oklahoma City, OK | 5 | $1,845 | $51,461 | 3.59% |
| Tampa, FL | 6 | $1,711 | $47,085 | 3.63% |
| Charlotte, NC | 7 | $1,871 | $53,076 | 3.53% |
| Cleveland, OH | 8 | $1,741 | $49,925 | 3.49% |
| Grand Rapids, MI | 9 | $1,864 | $53,780 | 3.47% |
| Las Vegas, NV | 10 | $1,725 | $51,575 | 3.34% |
| San Antonio, TX | 11 | $1,801 | $53,122 | 3.39% |
| Nashville, TN | 12 | $1,866 | $54,047 | 3.45% |
| Buffalo, NY | 13 | $1,656 | $50,962 | 3.25% |
| Riverside, CA | 14 | $1,793 | $55,092 | 3.25% |
| Albany, NY | 15 | $2,007 | $62,283 | 3.22% |
| Detroit, MI | 16 | $1,688 | $52,603 | 3.21% |
| New Haven, CT | 17 | $1,943 | $61,640 | 3.15% |
| Milwaukee, WI | 18 | $1,768 | $54,336 | 3.25% |
| Rochester, NY | 19 | $1,685 | $52,483 | 3.21% |
| Pittsburgh, PA | 20 | $1,690 | $52,499 | 3.22% |
| Indianapolis, IN | 21 | $1,684 | $52,842 | 3.19% |
| Phoenix, AZ | 22 | $1,698 | $53,723 | 3.16% |
| Los Angeles, CA | 23 | $1,905 | $60,705 | 3.14% |
| Cincinnati, OH | 24 | $1,722 | $55,501 | 3.10% |
| Houston, TX | 25 | $1,845 | $59,649 | 3.09% |
| Dallas, TX | 26 | $1,850 | $59,946 | 3.09% |
| Columbus, OH | 27 | $1,727 | $55,878 | 3.09% |
| St. Louis, MO | 28 | $1,663 | $55,066 | 3.02% |
| Providence, RI | 29 | $1,724 | $56,849 | 3.03% |
| Portland, ME | 30 | $1,784 | $58,584 | 3.04% |
| Salt Lake City, UT | 31 | $1,890 | $62,192 | 3.04% |
| Richmond, VA | 32 | $1,743 | $59,919 | 2.91% |
| Allentown, PA | 33 | $1,725 | $58,699 | 2.94% |
| Austin, TX | 34 | $1,893 | $63,437 | 2.98% |
| Sacramento, CA | 35 | $1,757 | $60,003 | 2.93% |
| New York, NY | 36 | $1,913 | $67,296 | 2.84% |
| Kansas City, MO | 37 | $1,673 | $57,388 | 2.92% |
| Portland, OR | 38 | $1,752 | $60,286 | 2.91% |
| Atlanta, GA | 39 | $1,634 | $57,000 | 2.87% |
| Chicago, IL | 40 | $1,697 | $61,828 | 2.74% |
| Bridgeport, CT | 41 | $2,315 | $84,233 | 2.75% |
| Virginia Beach, VA | 42 | $1,595 | $58,852 | 2.71% |
| Philadelphia, PA | 43 | $1,727 | $62,513 | 2.76% |
| San Diego, CA | 44 | $1,784 | $64,309 | 2.77% |
| Seattle, WA | 45 | $1,968 | $70,475 | 2.79% |
| Worcester, MA | 46 | $1,640 | $64,367 | 2.55% |
| Hartford, CT | 47 | $1,791 | $69,869 | 2.56% |
| Urban Honolulu, HI | 48 | $1,871 | $74,460 | 2.51% |
| Boston, MA | 49 | $1,888 | $75,389 | 2.50% |
| Raleigh, NC | 50 | $1,562 | $63,363 | 2.47% |
| Minneapolis, MN | 51 | $1,676 | $68,778 | 2.44% |
| Denver, CO | 52 | $1,658 | $65,614 | 2.53% |
| San Francisco, CA | 53 | $2,004 | $81,552 | 2.46% |
| Baltimore, MD | 54 | $1,626 | $70,936 | 2.29% |
| Oxnard, CA | 55 | $1,701 | $77,348 | 2.20% |
| Washington, DC | 56 | $1,881 | $92,324 | 2.04% |
| San Jose, CA | 57 | $2,003 | $95,405 | 2.10% |
Methodology
In this study, Care.com data analysts compared housekeeping jobs posted on Care.com in 57 metropolitan statistical areas (M.S.A.) in the United States. They computed the total amount spent on housekeeping per year by multiplying the number of times a housekeeper cleans that home per year by the number of hours per visit and the average hourly rate listed in the job.
The final ranking measures the average amount of money spent on housekeeping per year as a percentage of median household income in that M.S.A. Income data is from the U.S. Census Bureau’s 2015 American Community Survey.
https://www.youtube.com/watch?v=Ydl1X7on1kI
Want to check out more of our studies? Feel free to peruse this list:
- The 20 Most Family-Friendly Cities for Halloween in 2016
- The 10 Best Cities in America to Raise the Next Rock Star
- The Best — and Worst — States for Child Care
- Best in Style: These 10 Cities Have the Best-Groomed Dogs
- Dads Are Getting More Involved on Valentine’s Day — By the Numbers
- Grab Your Pup’s Leash: These Are the Best U.S. Cities for Walking Your Dog
- How Child Care Could Swing the Election
- How Much Do the Holidays Cost?
- Listen up, College Kids: Here Are the Top 20 Cities to Make Bank Over Break
- These Are the States With the Healthiest Pets — Is Yours One of Them?
- Want a New You in the New Year? Here’s Where You’re Most Likely to Make That Happen in 2017
- Want to Babysit on Valentine’s Day? These Are the Cities Where You Could Make Bank