

Fact: Animals make our lives infinitely better.
(Think about it: Have you ever seen a cute kitty Youtube video that didn’t fill you with joy?…Didn’t think so…)
If you aren’t a pet parent, you might brush this off as biased hyperbole. But we’re not just saying this because we love pets: we’re saying this because SCIENCE. Case in point: recently, researchers have discovered that:
- Having a pet makes us happier and healthier humans;
- We actually get more satisfaction from our relationships with our pets than we do with other humans (hence why your brother seems to spend wayyy more time with Sir Fuzzytoes than with you); and,
- We feel the same amount of grief over the loss of a pet as we do over the loss of a human loved one…and sometimes even more so.
Now, if you are a pet parent, you’re sitting there going, “Well…duh.”
In your eyes, your pet is your baby, your soulmate and your best friend all rolled into one. And, in return for all the love your pet gives you, you try to keep her as happy and healthy as possible — whether it’s by taking her out on regular walks, by feeding her good, nutritious food, or by enrolling her in a doggy day care to help her blow off some steam with her buddies during the day.
The question is: Are you living in a place that makes it easy to do this?
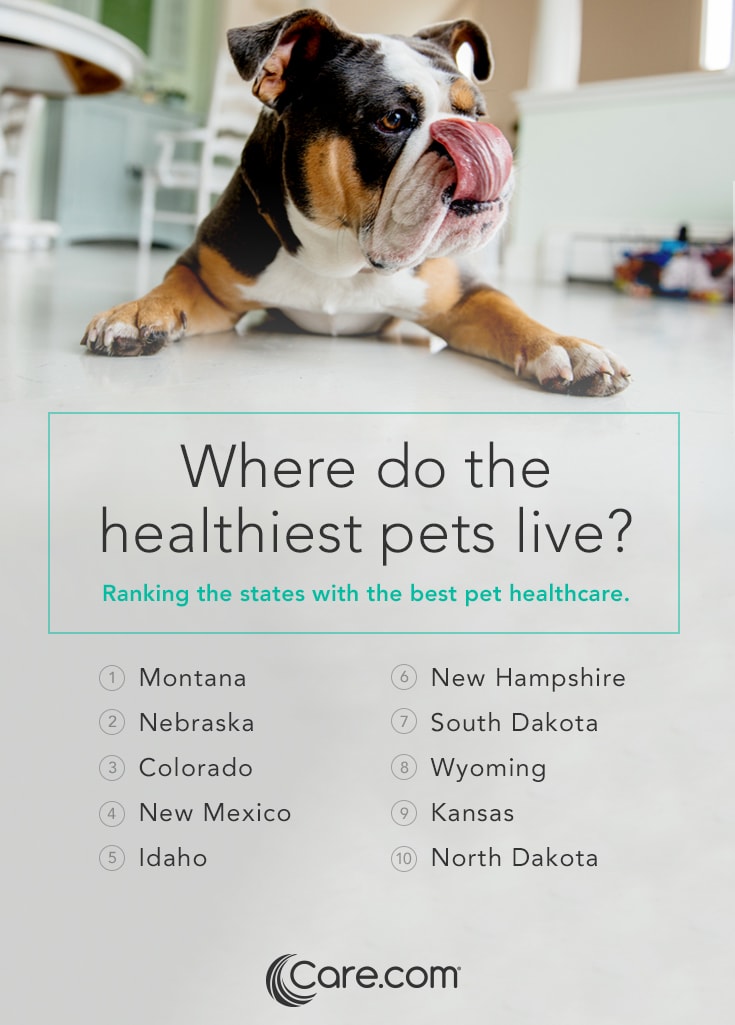
To figure this out, Care.com analysts looked at the data on pet care in each state, and ranked them across four different categories: an “Illness” rank, an “Access to Vet Care” rank, a “Healthy Environment” rank, and a “Total Pet Spend” rank. Then, the analysts combined these metrics into one all-encompassing “Pet Health” rank. The states that ranked the highest had a low prevalence of pet illnesses, higher access to veterinary care, healthier environments for pets, and higher pet-related spending (that didn’t involve the vet).
And now, the moment you’ve all been waiting for…
Here are the 10 states with the healthiest pets!
Don’t see your state on that list? Then take a look at the chart below to see how it fared across each rank:
| State | Prevalence of Illness Rank | Access to Vet Care Rank | Healthy Environment Rank | Total Pet Spend Rank | Overall Pet Health Rank |
| Montana | 1 | 2 | 3 | 17 | 1 |
| Nebraska | 9 | 1 | 27 | 15 | 2 |
| Colorado | 2 | 6 | 45 | 2 | 3 |
| New Mexico | 6 | 6 | 33 | 28 | 4 |
| New Hampshire | 28 | 5 | 6 | 1 | 5 |
| Idaho | 13 | 3 | 38 | 36 | 6 |
| South Dakota | 2 | 16 | 20 | 46 | 7 |
| Wyoming | 13 | 8 | 12 | 26 | 8 |
| North Dakota | 2 | 38 | 17 | 28 | 9 |
| Kansas | 27 | 4 | 37 | 22 | 10 |
| Minnesota | 8 | 20 | 22 | 11 | 11 |
| Wisconsin | 11 | 14 | 25 | 20 | 12 |
| Vermont | 28 | 9 | 5 | 16 | 13 |
| District of Columbia | 20 | 44 | 1 | 9 | 14 |
| Alaska | 13 | 22 | 4 | 7 | 15 |
| New Jersey | 16 | 35 | 2 | 5 | 16 |
| Connecticut | 23 | 18 | 9 | 3 | 17 |
| Maryland | 22 | 15 | 23 | 8 | 18 |
| Virginia | 25 | 12 | 31 | 6 | 19 |
| Illinois | 10 | 29 | 26 | 14 | 20 |
| Iowa | 24 | 10 | 18 | 33 | 21 |
| Massachusetts | 20 | 26 | 11 | 4 | 22 |
| Arizona | 7 | 26 | 46 | 24 | 23 |
| Nevada | 5 | 41 | 39 | 34 | 24 |
| Oregon | 32 | 13 | 14 | 19 | 25 |
| Utah | 12 | 38 | 49 | 13 | 26 |
| Maine | 28 | 17 | 18 | 21 | 27 |
| Rhode Island | 17 | 48 | 15 | 12 | 28 |
| Michigan | 18 | 42 | 13 | 42 | 29 |
| Hawaii | 18 | 50 | 7 | 41 | 30 |
| Washington | 37 | 30 | 10 | 10 | 31 |
| Missouri | 36 | 23 | 28 | 27 | 32 |
| California | 31 | 30 | 50 | 25 | 33 |
| Indiana | 35 | 28 | 43 | 18 | 34 |
| New York | 33 | 47 | 8 | 28 | 35 |
| Oklahoma | 43 | 11 | 30 | 44 | 36 |
| Pennsylvania | 34 | 43 | 35 | 37 | 37 |
| Kentucky | 38 | 20 | 51 | 45 | 38 |
| Delaware | 42 | 35 | 16 | 23 | 39 |
| Florida | 43 | 19 | 29 | 35 | 40 |
| West Virginia | 25 | 51 | 21 | 50 | 41 |
| North Carolina | 46 | 24 | 36 | 32 | 42 |
| Ohio | 39 | 37 | 34 | 40 | 43 |
| Georgia | 40 | 30 | 41 | 39 | 44 |
| Texas | 41 | 34 | 44 | 38 | 45 |
| Tennessee | 47 | 33 | 42 | 43 | 46 |
| Arkansas | 43 | 49 | 24 | 49 | 47 |
| South Carolina | 48 | 45 | 47 | 31 | 48 |
| Louisiana | 50 | 38 | 32 | 48 | 49 |
| Alabama | 51 | 25 | 48 | 47 | 50 |
| Mississippi | 49 | 46 | 40 | 51 | 51 |
Methodology
This study considers all 50 states of the United States and the District of Colombia. The “Overall Pet Health Rank” was based on scores in four categories: Prevalence of Illness, Access to Vet Care, Healthy Environment, and Total Pet Spend:
- “Prevalence of Illness” includes the prevalence of the following diseases per 10,000 pets: Diabetes, Heartworm, Dental Disease, Ottis Externa, Fleas Tickets, Roundworm, Hookworm, Tapeworm, and Whipworm. Average lifespan is also included in this category. Data is from the Banfield State of Pet Health Report 2016.
- “Access to Vet Care” includes the number of veterinary offices and number of veterinary employees per household with pet. These data are based on the Census Bureau.
- “Healthy Environment” includes percent of protected land, percent of sheltered animals per household with pets, air quality, number of parks per household with pets, and WalkScore. These data come from United States Geological Survey, Shelter Animals Count, the American Lung Association: State of the Air 2016, StateParks.com, and WalkScore.com
- “Total Pet Spend” includes the number of pet businesses per household with pets, non-vet pet spending per household with pets, and average monthly pet insurance cost. With the exception of pet insurance cost, the more spending on pets and the higher the number of pet businesses per household with pets contribute to a higher ranking in this category. All dollar amounts are divided by the median income in the state to account for differences in the cost of living. These data are from the Census Bureau, and PetInsuranceQuotes.com.
Metrics in these categories were normalized on a scale from 0 to 100, and combined using a weighted average with the following weights: Prevalence of Illness (40%), Access to Vet Care (30%), Healthy Environment (20%), Non-Veterinary Pet-Related Expenditures (10%).
Want to check out more of our studies? Feel free to peruse this list:
- The 20 Most Family-Friendly Cities for Halloween in 2016
- The 10 Best Cities in America to Raise the Next Rock Star
- The Best — and Worst — States for Child Care
- Best in Style: These 10 Cities Have the Best-Groomed Dogs
- Dads Are Getting More Involved on Valentine’s Day — Here’s How
- Grab Your Pup’s Leash: These Are the Best U.S. Cities for Walking Your Dog
- How Child Care Could Swing the Election
- How Much Do the Holidays Cost?
- Listen up, College Kids: Here Are the Top 20 Cities to Make Bank Over Break
- Think You’re a Neat Freak? Here’s Where People Pay the Most for Housekeeping
- Want a New You in the New Year? Here’s Where You’re Most Likely to Make That Happen in 2017
- Want to Babysit on Valentine’s Day? These Are the Cities Where You Could Make Bank
