
Halloween became one of my favorite holidays — but only until after I had kids.
The whole season starts as soon as the candy corn hits the shelves (so…September) and every weekend is full of spirited fun as you work your way up to the big night. And between attending fall festivals, picking pumpkins, planning costumes and trick-or-treating, Halloween is more than just a night: it’s a season.
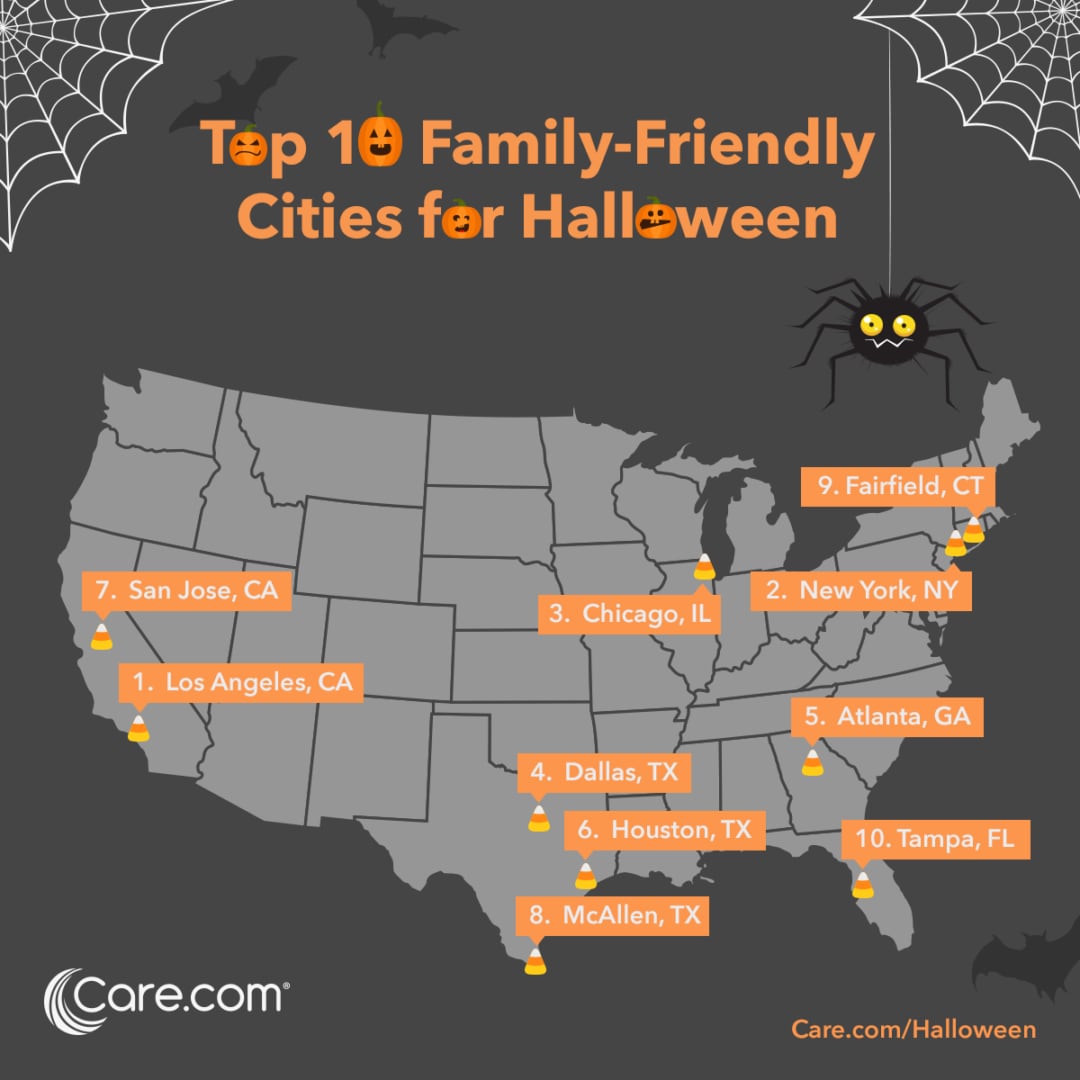
So, when ranking the best cities, we at Care.com wanted to focus on what Halloween spirit is to families: a fun season and a safe night.
In order to come up with the best (and worst) cities for families this Halloween, we took a look at the top 100 metro areas* and analyzed:
- The percentage of their populations under the age of 15;
- Their crime rates;
- The timing of sunset;
- The average temperature there on October 31st;
- The number of Halloween stores that they have; and,
- The density of owner-occupied homes.
We then weighted this data with a “Halloween Spirit” score, which was comprised of the number of haunted houses, pumpkin patches, fall festivals, etc., that are available in those areas. (See our full methodology below.)
Topping our list are Los Angeles, New York City and Chicago. At the bottom are Albany, NY, Birmingham, AL, and the worst city for Halloween this year…Spokane, WA.
For tips on creating your own Halloween fun — including DIY costumes, safety tips, recipes and crafts — go to Care.com/Halloween!
Halloween Index From Best to Worst by Metro
Note: The values below can range from 0 to 500, with 0 being the worst score and 500 being the best. On each score, the average across all cities is 250, and every 100 points above or below represents one standard deviation from the mean.
- Kids Score: % of population under 15
- Crime Score: City-data crime index
- Retail Score: Number of Halloween stores
- Density Score: Owner-occupied housing units per square mile
- “Halloween Spirit” Score: Number of Funtober events
- Weather Score: Sunset time on Oct. 31 and average temperature on Oct. 31
|
Halloween Index Rank |
City Name |
Kids Score |
Crime Score |
Retail Score |
Density Score |
Halloween Spirit Score |
Weather Score |
Overall Family-Friendly Halloween Score |
|
1 |
Los Angeles, CA |
231.0 |
369.1 |
500.0 |
458.5 |
434.0 |
271.0 |
377.3 |
|
2 |
New York, NY |
200.0 |
385.7 |
500.0 |
490.3 |
361.4 |
177.8 |
352.5 |
|
3 |
Chicago, IL |
265.8 |
253.7 |
500.0 |
429.4 |
500.0 |
163.6 |
352.1 |
|
4 |
Dallas, TX |
366.5 |
272.1 |
488.4 |
281.2 |
330.2 |
346.9 |
347.5 |
|
5 |
Atlanta, GA |
316.1 |
138.5 |
411.9 |
308.3 |
500.0 |
333.0 |
334.6 |
|
6 |
Houston, TX |
374.2 |
187.5 |
377.9 |
263.3 |
299.1 |
358.2 |
310.0 |
|
7 |
San Jose, CA |
254.2 |
431.1 |
292.8 |
341.2 |
267.9 |
259.5 |
307.8 |
|
8 |
McAllen, TX |
500.0 |
408.7 |
233.3 |
189.6 |
75.8 |
432.3 |
306.6 |
|
9 |
Fairfield, CT |
250.3 |
446.8 |
190.8 |
500.0 |
267.9 |
146.2 |
300.3 |
|
10 |
Tampa, FL |
145.8 |
369.8 |
292.8 |
344.3 |
226.4 |
415.1 |
299.0 |
|
11 |
Provo, UT |
500.0 |
424.3 |
199.3 |
151.2 |
242.0 |
230.3 |
291.2 |
|
12 |
Philadelphia, PA |
207.7 |
205.2 |
403.4 |
338.7 |
371.7 |
195.0 |
286.9 |
|
13 |
Ogden, UT |
500.0 |
284.6 |
182.3 |
322.2 |
216.0 |
214.2 |
286.6 |
|
14 |
Washington, DC |
242.6 |
172.0 |
394.9 |
388.4 |
288.7 |
230.1 |
286.1 |
|
15 |
Phoenix, AZ |
316.1 |
284.6 |
428.9 |
194.3 |
252.3 |
237.8 |
285.7 |
|
16 |
Miami, FL |
153.5 |
187.6 |
335.3 |
425.0 |
179.7 |
428.0 |
284.9 |
|
17 |
San Diego, Ca |
215.5 |
405.8 |
352.3 |
220.8 |
236.8 |
260.7 |
282.0 |
|
18 |
Boston, MA |
149.7 |
328.1 |
284.3 |
396.9 |
402.9 |
124.9 |
281.1 |
|
19 |
San Antonio, TX |
331.6 |
241.5 |
241.8 |
264.7 |
210.8 |
395.0 |
280.9 |
|
20 |
Boise City, ID |
362.6 |
416.3 |
216.3 |
238.2 |
174.5 |
253.8 |
276.9 |
|
21 |
Denver, CO |
273.5 |
309.8 |
326.8 |
231.2 |
356.2 |
153.9 |
275.2 |
|
22 |
Portland, OR |
223.2 |
285.8 |
275.8 |
211.1 |
475.6 |
170.3 |
273.6 |
|
23 |
El Paso, TX |
420.6 |
396.2 |
207.8 |
238.2 |
101.8 |
274.0 |
273.1 |
|
24 |
New Haven, CT |
165.1 |
203.6 |
199.3 |
488.2 |
428.8 |
146.6 |
271.9 |
|
25 |
Austin, TX |
289.0 |
323.1 |
216.3 |
230.2 |
195.2 |
377.5 |
271.9 |
|
26 |
Grand Rapids, MI |
292.9 |
385.4 |
207.8 |
267.5 |
226.4 |
245.9 |
271.0 |
|
27 |
Salt Lake City, UT |
436.1 |
166.4 |
301.3 |
304.1 |
190.1 |
224.8 |
270.5 |
|
28 |
Charlotte, NC |
292.9 |
319.9 |
199.3 |
250.1 |
273.1 |
286.2 |
270.2 |
|
29 |
Seattle, WA |
207.7 |
237.8 |
284.3 |
227.8 |
500.0 |
161.4 |
269.8 |
|
30 |
Sacramento, CA |
254.2 |
325.2 |
335.3 |
183.9 |
262.7 |
247.1 |
268.1 |
|
31 |
Orlando, FL |
211.6 |
223.3 |
258.8 |
270.9 |
231.6 |
400.3 |
266.1 |
|
32 |
Indianapolis, IN |
312.3 |
125.7 |
233.3 |
237.3 |
392.5 |
289.8 |
265.2 |
|
33 |
Cincinnati, OH |
269.7 |
174.7 |
284.3 |
280.3 |
304.3 |
275.3 |
264.8 |
|
34 |
Columbus, OH |
273.5 |
261.6 |
241.8 |
214.8 |
330.2 |
258.5 |
263.4 |
|
35 |
Providence, RI |
145.8 |
302.0 |
258.8 |
391.3 |
351.0 |
129.7 |
263.1 |
|
36 |
Minneapolis, MN |
273.5 |
196.6 |
250.3 |
259.6 |
434.0 |
142.0 |
259.3 |
|
37 |
Sarasota, FL |
37.4 |
308.1 |
199.3 |
425.2 |
158.9 |
419.9 |
258.1 |
|
38 |
San Francisco, CA |
153.5 |
236.8 |
301.3 |
208.3 |
371.7 |
261.9 |
255.6 |
|
39 |
Akron, OH |
165.1 |
233.9 |
190.8 |
275.7 |
434.0 |
220.0 |
253.3 |
|
40 |
Charleston, SC |
227.1 |
437.4 |
182.3 |
164.2 |
169.3 |
332.7 |
252.2 |
|
41 |
Las Vegas, NV |
269.7 |
308.6 |
267.3 |
147.0 |
299.1 |
218.4 |
251.7 |
|
42 |
Ventura, CA |
269.7 |
342.9 |
190.8 |
183.4 |
257.5 |
264.2 |
251.4 |
|
43 |
Virginia Beach, VA |
227.1 |
315.6 |
207.8 |
297.4 |
200.4 |
241.3 |
248.3 |
|
44 |
Jacksonville, FL |
227.1 |
272.1 |
216.3 |
213.3 |
158.9 |
378.8 |
244.4 |
|
45 |
Omaha, NE |
327.7 |
282.9 |
216.3 |
206.6 |
210.8 |
212.8 |
242.8 |
|
46 |
Fresno, CA |
432.3 |
307.0 |
216.3 |
129.0 |
127.8 |
243.0 |
242.6 |
|
47 |
Kansas City, MO |
300.6 |
173.8 |
275.8 |
195.0 |
257.5 |
240.8 |
240.6 |
|
48 |
Oklahoma City, OK |
296.8 |
233.5 |
250.3 |
169.8 |
184.9 |
306.1 |
240.2 |
|
49 |
Lakeland, FL |
227.1 |
270.8 |
190.8 |
174.2 |
164.1 |
410.3 |
239.6 |
|
50 |
Madison, WI |
188.4 |
394.6 |
182.3 |
217.1 |
330.2 |
120.9 |
238.9 |
|
51 |
Cleveland, OH |
196.1 |
52.7 |
267.3 |
332.7 |
340.6 |
239.2 |
238.1 |
|
52 |
Detroit, MI |
223.2 |
0.0 |
369.4 |
288.7 |
309.5 |
229.7 |
236.7 |
|
53 |
Bakersfield, CA |
443.9 |
311.2 |
207.8 |
122.2 |
86.2 |
246.0 |
236.2 |
|
54 |
Des Moines, IA |
323.9 |
292.1 |
182.3 |
186.1 |
242.0 |
188.7 |
235.8 |
|
55 |
Baltimore, MD |
207.7 |
94.1 |
258.8 |
322.3 |
299.1 |
228.3 |
235.1 |
|
56 |
New Orleans, LA |
223.2 |
215.4 |
207.8 |
210.7 |
231.6 |
316.1 |
234.1 |
|
57 |
Melbourne, FL |
83.8 |
368.0 |
182.3 |
235.1 |
133.0 |
398.2 |
233.4 |
|
58 |
Winston-Salem, NC |
238.7 |
232.0 |
190.8 |
193.5 |
283.5 |
260.1 |
233.1 |
|
59 |
Worcester, MA |
192.2 |
289.1 |
199.3 |
372.0 |
216.0 |
126.6 |
232.5 |
|
60 |
Richmond, VA |
207.7 |
299.4 |
250.3 |
193.8 |
200.4 |
242.4 |
232.3 |
|
61 |
Pittsburgh, PA |
103.2 |
294.8 |
258.8 |
254.5 |
262.7 |
218.9 |
232.2 |
|
62 |
Greenville, SC |
231.0 |
282.3 |
182.3 |
194.5 |
190.1 |
305.8 |
231.0 |
|
63 |
Stockton, CA |
393.6 |
132.6 |
199.3 |
179.4 |
221.2 |
249.9 |
229.3 |
|
64 |
Wichita Falls, TX |
343.2 |
313.6 |
182.3 |
152.6 |
81.0 |
298.7 |
228.6 |
|
65 |
Nashville, TN |
261.9 |
228.6 |
190.8 |
198.5 |
299.1 |
191.8 |
228.5 |
|
66 |
Durham, NC |
192.2 |
247.0 |
182.3 |
274.8 |
221.2 |
250.8 |
228.0 |
|
67 |
Fort Myers, FL |
99.3 |
250.6 |
199.3 |
294.8 |
96.6 |
426.1 |
227.8 |
|
68 |
Allentown, PA |
180.6 |
314.3 |
216.3 |
229.9 |
247.2 |
170.1 |
226.4 |
|
69 |
Albuquerque, NM |
258.1 |
183.9 |
224.8 |
268.4 |
200.4 |
220.5 |
226.0 |
|
70 |
Colorado Springs, CO |
300.6 |
308.5 |
207.8 |
169.8 |
205.6 |
150.9 |
223.9 |
|
71 |
Greensboro, NC |
219.3 |
334.5 |
190.8 |
187.4 |
138.1 |
266.2 |
222.7 |
|
72 |
Columbia, SC |
223.2 |
246.3 |
182.3 |
221.2 |
138.1 |
315.7 |
221.1 |
|
73 |
Hartford, CT |
161.3 |
211.0 |
224.8 |
285.2 |
293.9 |
136.3 |
218.7 |
|
74 |
Baton Rouge, LA |
265.8 |
218.7 |
182.3 |
215.7 |
112.2 |
306.5 |
216.9 |
|
75 |
Dayton, OH |
200.0 |
169.9 |
233.3 |
209.1 |
231.6 |
256.9 |
216.8 |
|
76 |
Milwaukee, WI |
258.1 |
150.8 |
190.8 |
277.1 |
299.1 |
122.9 |
216.5 |
|
77 |
Scranton, PA |
114.8 |
390.8 |
207.8 |
150.5 |
267.9 |
159.4 |
215.2 |
|
78 |
Tulsa, OK |
300.6 |
200.6 |
182.3 |
147.1 |
164.1 |
289.2 |
214.0 |
|
79 |
Knoxville, TN |
169.0 |
194.4 |
190.8 |
176.3 |
205.6 |
307.2 |
207.2 |
|
80 |
Harrisburg, PA |
172.9 |
191.9 |
190.8 |
170.1 |
325.0 |
190.0 |
206.8 |
|
81 |
Syracuse, NY |
184.5 |
257.7 |
199.3 |
166.3 |
247.2 |
154.3 |
201.5 |
|
82 |
Youngstown, OH |
145.8 |
213.3 |
207.8 |
235.0 |
190.1 |
210.4 |
200.4 |
|
83 |
Deltona, FL |
68.4 |
178.2 |
182.3 |
237.8 |
148.5 |
387.0 |
200.4 |
|
84 |
Toledo, OH |
219.3 |
138.1 |
199.3 |
198.5 |
195.2 |
231.4 |
197.0 |
|
85 |
Jackson, MS |
300.6 |
120.2 |
182.3 |
156.4 |
148.5 |
270.5 |
196.4 |
|
86 |
Little Rock, AR |
269.7 |
50.9 |
190.8 |
157.7 |
236.8 |
268.8 |
195.8 |
|
87 |
Springfield, MA |
145.8 |
197.0 |
199.3 |
309.8 |
190.1 |
128.4 |
195.1 |
|
88 |
Tucson, AZ |
203.9 |
216.9 |
258.8 |
128.7 |
153.7 |
205.9 |
194.7 |
|
89 |
Memphis, TN |
316.1 |
6.5 |
190.8 |
212.9 |
179.7 |
247.1 |
192.2 |
|
90 |
Rochester, NY |
172.9 |
227.6 |
199.3 |
187.9 |
195.2 |
163.6 |
191.1 |
|
91 |
Buffalo, NY |
145.8 |
129.3 |
199.3 |
267.7 |
210.8 |
180.8 |
189.0 |
|
92 |
St. Louis, MO |
223.2 |
5.1 |
224.8 |
224.2 |
257.5 |
196.8 |
188.6 |
|
93 |
Albany, NY |
141.9 |
292.2 |
199.3 |
162.7 |
210.8 |
124.3 |
188.5 |
|
94 |
Birmingham, AL |
246.4 |
32.7 |
190.8 |
170.2 |
210.8 |
223.4 |
179.0 |
|
95 |
Spokane, WA |
211.6 |
141.8 |
199.3 |
169.7 |
127.8 |
74.8 |
154.2 |
Methodology
Care.com took data from Funtober.com to aggregate Halloween Family Fun activities for the top 100 largest metro areas in the US*. This includes fall festivals; corn mazes; haunted houses; ghost tours; pumpkin patches; and Oktoberfests within a 50-mile radius**. The metro areas were then ranked using a combination of the “Halloween Spirit” rating; the number of Halloween stores within a 30-mile radius; the percentage of the population under 15; the average crime rate; the number of owner-occupied houses per square mile; and a weather score that included the average temperature and the time of sunset on October 31st. Each category was weighted equally in the overall metro-area ranking.
Sources Used for Data
US Census Bureau American Community Survey 2014, Funtober.com, Spirit Halloween, Halloween City, accuweather.com, city-data.com, timeanddate.com
* Five of the census-listed top 100 metro areas had to be excluded from the final list due to insufficient data
**Except for New York, NY, for which we used a 10-mile radius
Want to check out more of our studies? Feel free to peruse this list:
- The 20 Most Family-Friendly Cities for Halloween in 2016
- The 10 Best Cities in America to Raise the Next Rock Star
- The Best — and Worst — States for Child Care
- Dads Are Getting More Involved on Valentine’s Day — By the Numbers
- Grab Your Pup’s Leash: These Are the Best U.S. Cities for Walking Your Dog
- How Child Care Could Swing the Election
- How Much Do the Holidays Cost?
- Listen up, College Kids: Here Are the Top 20 Cities to Make Bank Over Break
- Want a New You in the New Year? Here’s Where You’re Most Likely to Make That Happen in 2017


