
From exercising to relaxing more, Care.com discovers where in England is the easiest to keep your resolutions – and where is the hardest!
We’ve all been there: the last of the Christmas leftovers has been devoured and rolling seems like the only possible means of travel. But on the horizon, there is the shiny promise of a fresh start – it’s the first day of 2019! Full of resolutions and good intentions, the new year looms like the first day of the rest of our lives.
However, it is not long before this year feels just like the last and all our optimistic goals have gone out the window in a haze of exasperated defeat and sheer forgetfulness.
But we shouldn’t feel too bad as it might not be entirely our own fault. It turns out that where we live can have a big effect on how well we stick to our New Year’s resolutions.
With this in mind, Care.com decided to investigate and find out which city in England makes it the easiest for you to succeed in your New Year’s resolutions and which makes it the hardest. Our analysts ranked the local authorities in England to show where you have the greatest chance of sticking to the four most popular New Year’s resolutions:
- Eating more healthily
- Exercising more
- Relaxing more
- Quitting smoking
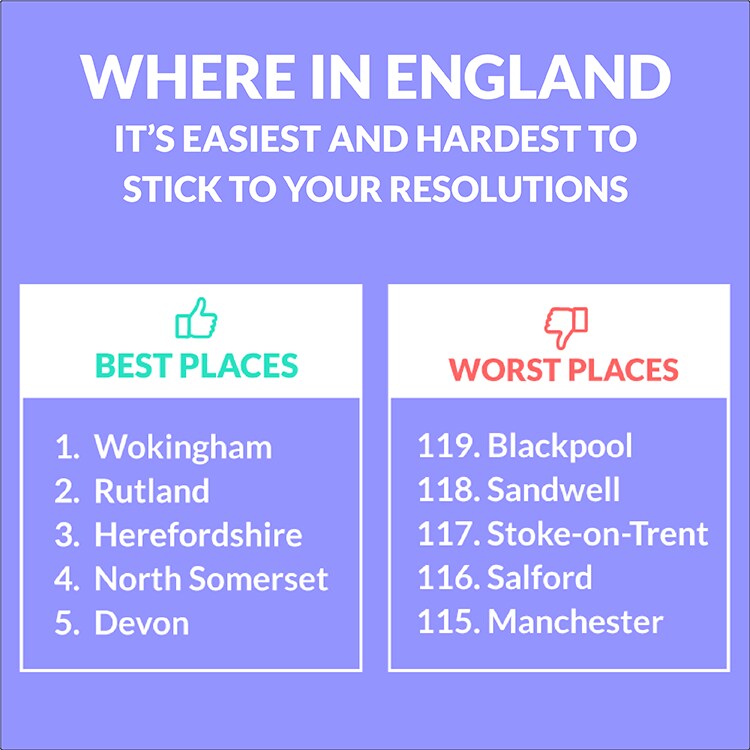
Where is the best place to keep your resolutions?
Congratulations to the residents of Wokingham, Berkshire! You have the best shot at keeping your New Year’s resolutions out of everywhere in England. Ranking in first place overall, the people of Wokingham also come in first for eating more healthily and quitting smoking. Closely followed are Rutland and Herefordshire.
The best resolution? Don’t get stressed by your resolutions!
And where is it hardest to keep your resolutions? Blackpool does the worst job of helping its citizens stick to their promises of the New Year. Also at the bottom of the list are Sandwell and Stoke-on-Trent.
If you live in a bad area for keeping new year’s resolutions, don’t become disheartened as it might not be such a bad thing. It may provide the extra motivation you need… or be a good excuse to not try it at all.
Wishing you all a happy and healthy New Year 2019 from Care.com!
Best Places in England to keep your New Year’s Resolutions
|
Local Authority |
OVERALL Rank |
Eat more healthily |
Exercise more |
Relax More |
Stop smoking |
|
Wokingham |
1 |
1 |
13 |
9 |
1 |
|
Rutland |
2 |
14 |
27 |
2 |
3 |
|
Herefordshire |
3 |
2 |
29 |
8 |
15 |
|
North Somerset |
4 |
13 |
7 |
41 |
10 |
|
Devon |
5 |
3 |
5 |
23 |
28 |
|
Buckinghamshire |
6 |
16 |
22 |
33 |
4 |
|
Oxfordshire |
7 |
7 |
12 |
43 |
7 |
|
York |
8 |
64 |
2 |
50 |
2 |
|
South Gloucestershire |
9 |
19 |
11 |
26 |
5 |
|
Dorset |
10 |
4 |
26 |
35 |
13 |
|
West Sussex |
11 |
24 |
21 |
1 |
22 |
|
Poole |
12 |
30 |
4 |
12 |
31 |
|
Surrey |
13 |
12 |
14 |
69 |
9 |
|
Bristol |
14 |
32 |
3 |
91 |
10 |
|
Isle of Wight |
15 |
9 |
40 |
3 |
40 |
|
West Berkshire |
16 |
33 |
6 |
30 |
24 |
|
Windsor and Maidenhead |
17 |
23 |
19 |
55 |
12 |
|
Hampshire |
18 |
22 |
17 |
6 |
47 |
|
Suffolk |
19 |
21 |
43 |
4 |
37 |
|
Somerset |
20 |
5 |
31 |
28 |
42 |
|
Cornwall |
21 |
11 |
38 |
7 |
55 |
|
Bracknell Forest |
22 |
31 |
19 |
27 |
25 |
|
Cambridgeshire |
23 |
17 |
8 |
67 |
50 |
|
East Sussex |
24 |
18 |
50 |
9 |
40 |
|
Shropshire |
25 |
6 |
40 |
48 |
38 |
|
Wiltshire |
26 |
8 |
23 |
60 |
38 |
|
Norfolk |
27 |
25 |
37 |
13 |
34 |
|
Hertfordshire |
28 |
43 |
33 |
21 |
19 |
|
Brighton and Hove |
29 |
26 |
1 |
70 |
100 |
|
Bath and North East Somerset |
30 |
15 |
9 |
98 |
27 |
|
East Riding of Yorkshire |
31 |
73 |
48 |
20 |
8 |
|
Leicestershire |
32 |
33 |
61 |
14 |
14 |
|
Northumberland |
33 |
35 |
51 |
17 |
23 |
|
Gloucestershire |
34 |
10 |
32 |
66 |
43 |
|
Bournemouth |
35 |
41 |
36 |
15 |
34 |
|
Cheshire West and Chester |
36 |
60 |
24 |
47 |
19 |
|
Wirral |
37 |
20 |
35 |
16 |
69 |
|
Solihull |
38 |
44 |
86 |
29 |
5 |
|
Warwickshire |
39 |
47 |
60 |
19 |
18 |
|
Cumbria |
40 |
42 |
25 |
61 |
50 |
|
Essex |
41 |
49 |
55 |
17 |
34 |
|
Stockport |
42 |
52 |
10 |
77 |
43 |
|
North Yorkshire |
43 |
29 |
17 |
63 |
66 |
|
Central Bedfordshire |
44 |
38 |
28 |
46 |
68 |
|
Trafford |
45 |
70 |
46 |
51 |
19 |
|
Cheshire East |
46 |
28 |
15 |
75 |
79 |
|
Torbay |
47 |
56 |
45 |
43 |
55 |
|
Kent |
48 |
35 |
34 |
49 |
76 |
|
Nottinghamshire |
49 |
39 |
57 |
36 |
61 |
|
Milton Keynes |
50 |
54 |
84 |
11 |
25 |
|
Worcestershire |
51 |
45 |
59 |
45 |
54 |
|
Durham |
52 |
63 |
44 |
62 |
43 |
|
Warrington |
53 |
77 |
53 |
78 |
17 |
|
Reading |
54 |
92 |
16 |
82 |
30 |
|
Derbyshire |
55 |
50 |
47 |
73 |
61 |
|
Portsmouth |
55 |
65 |
39 |
58 |
63 |
|
Bedford |
57 |
27 |
72 |
37 |
74 |
|
Swindon |
58 |
58 |
30 |
34 |
90 |
|
Staffordshire |
59 |
51 |
76 |
68 |
28 |
|
Lincolnshire |
60 |
48 |
65 |
25 |
76 |
|
Plymouth |
61 |
59 |
54 |
5 |
103 |
|
North Tyneside |
62 |
37 |
66 |
56 |
80 |
|
Sefton |
63 |
72 |
79 |
87 |
16 |
|
Stockton-on-Tees |
64 |
62 |
85 |
52 |
58 |
|
Peterborough |
65 |
52 |
69 |
42 |
93 |
|
Halton |
66 |
75 |
88 |
39 |
58 |
|
Newcastle upon Tyne |
67 |
85 |
42 |
104 |
63 |
|
Redcar and Cleveland |
68 |
86 |
70 |
65 |
58 |
|
Northamptonshire |
69 |
67 |
87 |
57 |
69 |
|
Southampton |
70 |
82 |
52 |
71 |
91 |
|
Greater London |
71 |
69 |
49 |
116 |
53 |
|
Southend-on-Sea |
72 |
76 |
62 |
53 |
100 |
|
Darlington |
73 |
108 |
70 |
86 |
47 |
|
Lancashire |
74 |
98 |
64 |
100 |
55 |
|
Gateshead |
75 |
78 |
81 |
76 |
80 |
|
Leeds |
76 |
111 |
58 |
54 |
85 |
|
Birmingham |
77 |
106 |
90 |
72 |
31 |
|
Liverpool |
78 |
91 |
73 |
95 |
65 |
|
Medway |
79 |
71 |
75 |
74 |
93 |
|
Luton |
80 |
107 |
109 |
31 |
43 |
|
Doncaster |
81 |
55 |
56 |
92 |
111 |
|
Dudley |
82 |
57 |
108 |
110 |
31 |
|
Coventry |
83 |
79 |
106 |
59 |
69 |
|
Telford and Wrekin |
84 |
61 |
115 |
22 |
80 |
|
North Lincolnshire |
85 |
40 |
94 |
32 |
114 |
|
St. Helens |
86 |
65 |
111 |
78 |
72 |
|
Thurrock |
87 |
88 |
100 |
38 |
96 |
|
Sheffield |
88 |
100 |
74 |
94 |
87 |
|
Wakefield |
89 |
90 |
101 |
40 |
99 |
|
Derby |
90 |
68 |
83 |
88 |
106 |
|
Wigan |
91 |
109 |
89 |
89 |
66 |
|
North East Lincolnshire |
92 |
80 |
80 |
64 |
113 |
|
Bury |
93 |
102 |
77 |
115 |
76 |
|
Blackburn with Darwen |
94 |
82 |
112 |
85 |
85 |
|
Kirklees |
95 |
95 |
98 |
96 |
88 |
|
Calderdale |
96 |
99 |
81 |
109 |
88 |
|
Knowsley |
97 |
46 |
105 |
101 |
111 |
|
Rotherham |
98 |
81 |
114 |
97 |
74 |
|
Middlesbrough |
99 |
87 |
103 |
81 |
105 |
|
Barnsley |
100 |
103 |
91 |
90 |
102 |
|
Wolverhampton |
101 |
84 |
116 |
111 |
47 |
|
South Tyneside |
102 |
93 |
96 |
93 |
103 |
|
Walsall |
103 |
105 |
113 |
107 |
50 |
|
Bradford |
104 |
89 |
99 |
99 |
106 |
|
Nottingham |
105 |
104 |
63 |
113 |
110 |
|
Oldham |
106 |
110 |
104 |
114 |
83 |
|
Sunderland |
107 |
74 |
92 |
84 |
118 |
|
Tameside |
108 |
114 |
93 |
108 |
93 |
|
Bolton |
109 |
101 |
110 |
118 |
72 |
|
Slough |
110 |
94 |
117 |
106 |
83 |
|
Hartlepool |
111 |
117 |
95 |
83 |
109 |
|
Rochdale |
112 |
97 |
102 |
117 |
98 |
|
Leicester |
113 |
113 |
107 |
105 |
96 |
|
Kingston upon Hull |
114 |
118 |
78 |
24 |
119 |
|
Manchester |
115 |
116 |
68 |
103 |
116 |
|
Salford |
116 |
111 |
67 |
119 |
115 |
|
Stoke-on-Trent |
117 |
96 |
118 |
112 |
106 |
|
Sandwell |
118 |
115 |
119 |
102 |
91 |
|
Blackpool |
119 |
119 |
97 |
80 |
117 |
Numbers in the table reflect the local authority’s performance in each category (1 is best, 119 is worst).
Methodology
The data analysis compares all local authorities in England in terms of their conditions to keep four popular New Year’s resolutions: “Eat more healthily”, “Exercise more”, “Relax more” and “Stop smoking”.
- “Eat more healthily” includes the proportion of the adult population meeting the recommended 5 portions of fruit and vegetables (‘5-a-day’) on a usual day (source: Public Health England based on Active Lives, Sport England, year: 2016/17) and the density of fastfood outlets (source: Public Health England, Risk Factors Intelligence based on PointX, year: 2014). The more people eating ‘5-a-day’ and the less fast food available, the easier it is to stick with a healthy diet.
- “Exercise more” includes the percentage of adults that meet CMO recommendations for physical activity (source: Public Health England, based on Active Lives, Sport England, year: 2016/17) and the percentage of people walking or cycling at least once per week (source: Walking and cycling statistics by the Department for Transport, based on the National Travel Survey and the Active Lives Survey, year: 2017).
- “Relax more / reduce stress” refers to the average annual number of hours of sunshine (source: Met Office, years: 1981 to 2010; data refer to the closest weather station), the percentage of the population exposed to road, rail and air transport noise of 65dB(A) or more during the daytime (source: Public Health England based on DEFRA, year: 2011) and the Estimates of Happiness (source: Office for National Statistics based on the Annual Population Survey Personal Well-being, year: 2017/18).
- “Stop smoking” is based on the current prevalence of smoking among adults (source: Public Health England, based on the Annual Population Survey).
Metrics within the four categories were normalized on a scale of 0 to 100. The final score was created by applying 25% weight to each of the four categories. The analysis was only descriptive. The lower a local authority’s ranking, the better it is.
